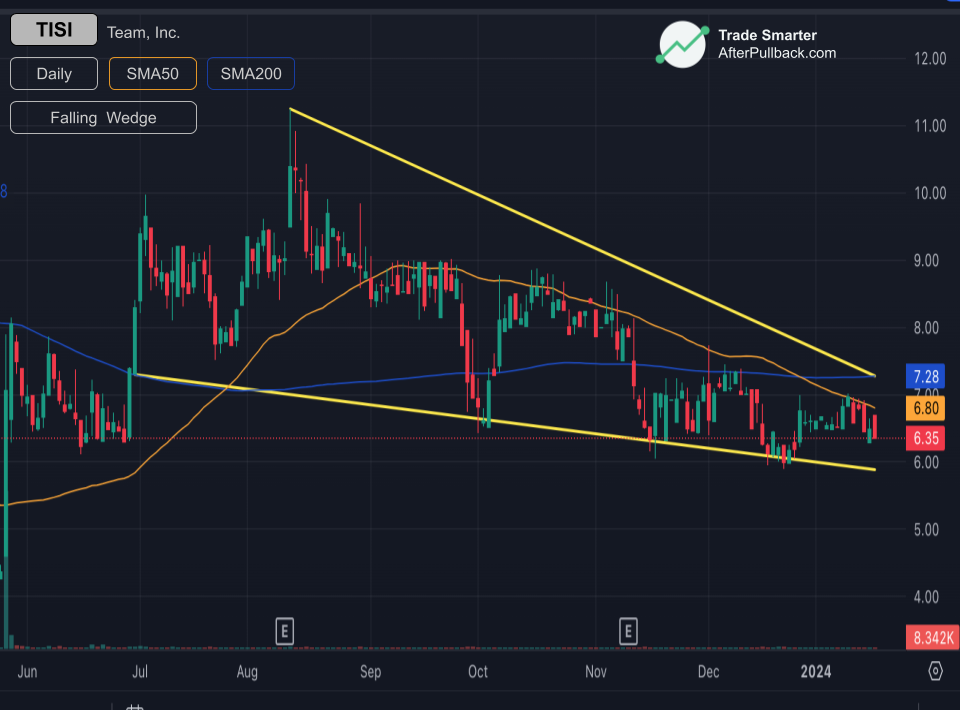
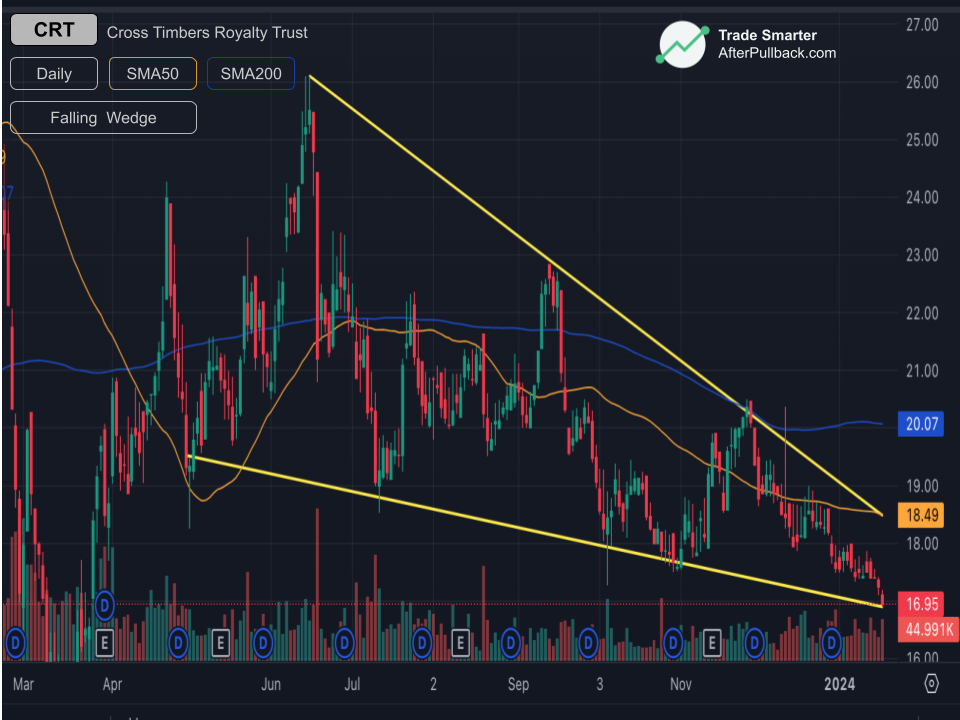
Pattern Trading pattern description

FALLING_WEDGE-pattern

Falling Wedge

It's the counterpart to the rising wedge but with a more optimistic twist. It's a technical chart pattern that can signal a potential upward reversal in a downward trend. Imagine a downward-sloping triangle, where the price bounces between two converging trendlines, one connecting the highs and the other connecting the lows. As the price forms lower highs and lower lows, the wedge narrows, indicating increasing buying pressure and a possible breakout to the upside.

Falling Wedge, more examples


Market data may be delayed by 15 minutes or more and is provided by financial exchanges or third-party providers. AfterPullback does not verify or guarantee its accuracy and assumes no responsibility to do so. This website is not operated by a licensed attorney, accountant, or financial advisor. Nothing on this site constitutes financial advice or replaces consultation with a qualified professional who understands your specific circumstances. Always consult a licensed financial advisor before making investment decisions.