Learn about the supported technical price action patterns to filter symbols with the specific pattern in the screeners tab or build your trading strategy. You can use your strategy in the Backtests tab to evaluate historical performance and in the Scanners tab to search for signals that match your specific trading opportunities.
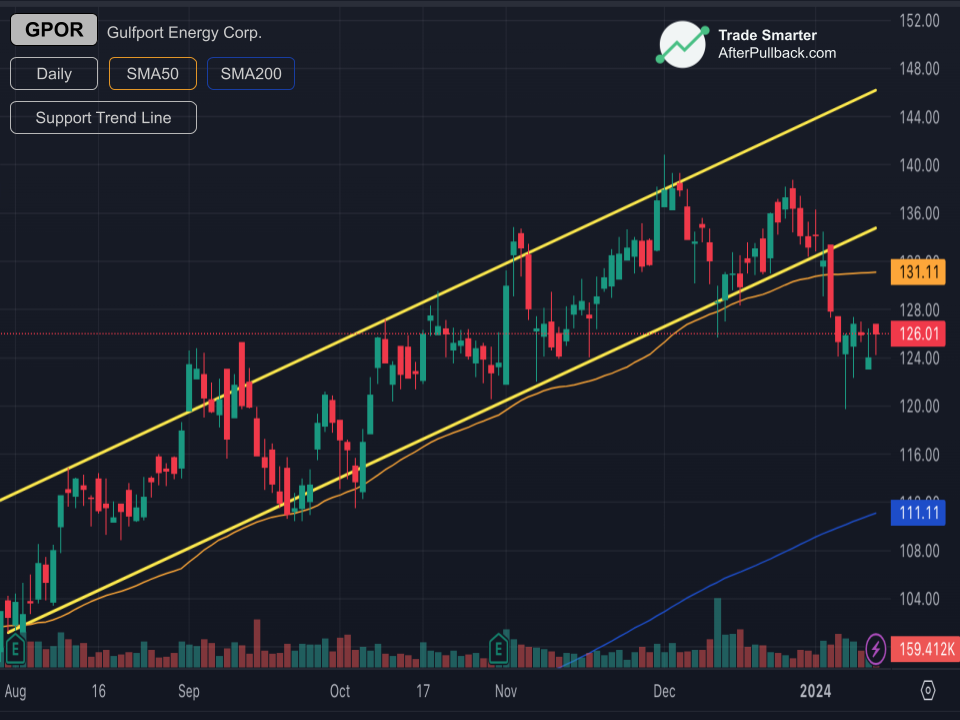
Support Trend Line
A Support Trend Line in trading is a line drawn on a chart connecting several low price points of an asset over time. It generally indicates an upward trend, where the price tends to bounce back up...
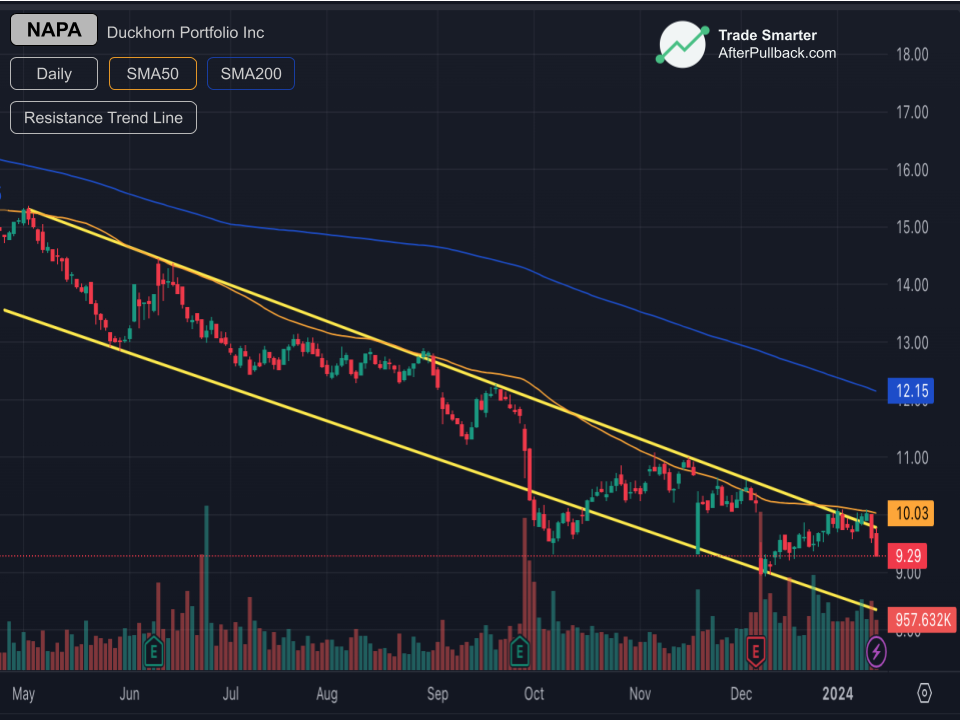
Resistance Trend Line
A Resistance Trend Line in trading is the opposite of a Support Trend Line. It's a line drawn on a chart connecting several high price points of an asset over time. It generally indicates a downwar...
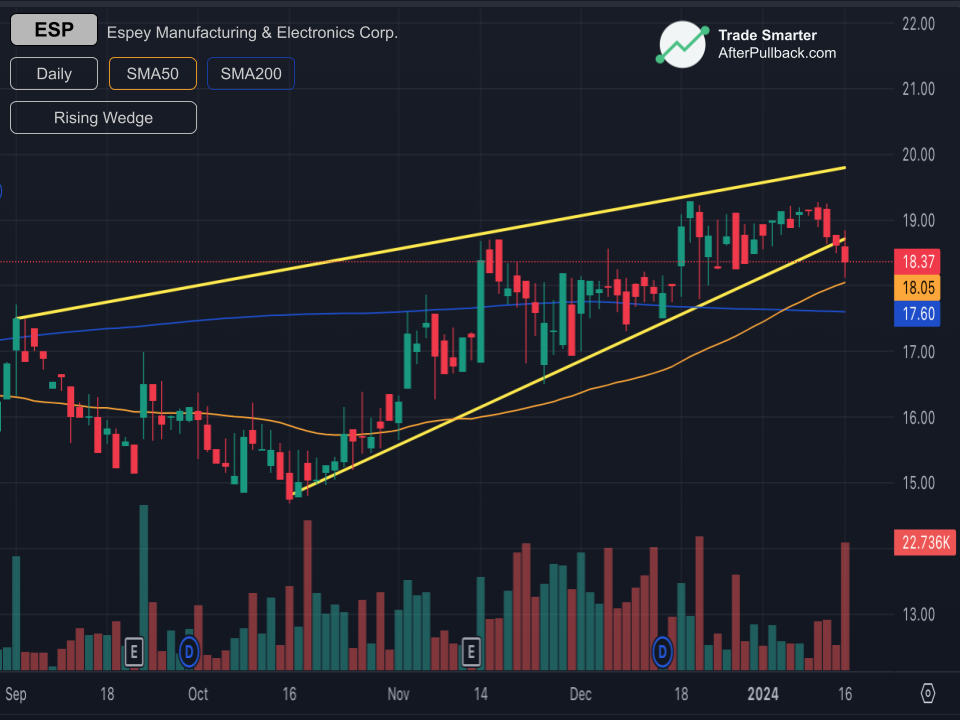
Rising Wedge
A rising wedge is a technical chart pattern in trading that can signal a potential downward reversal in an upward trend. It's essentially a triangle pattern that slopes upwards, with the price boun...
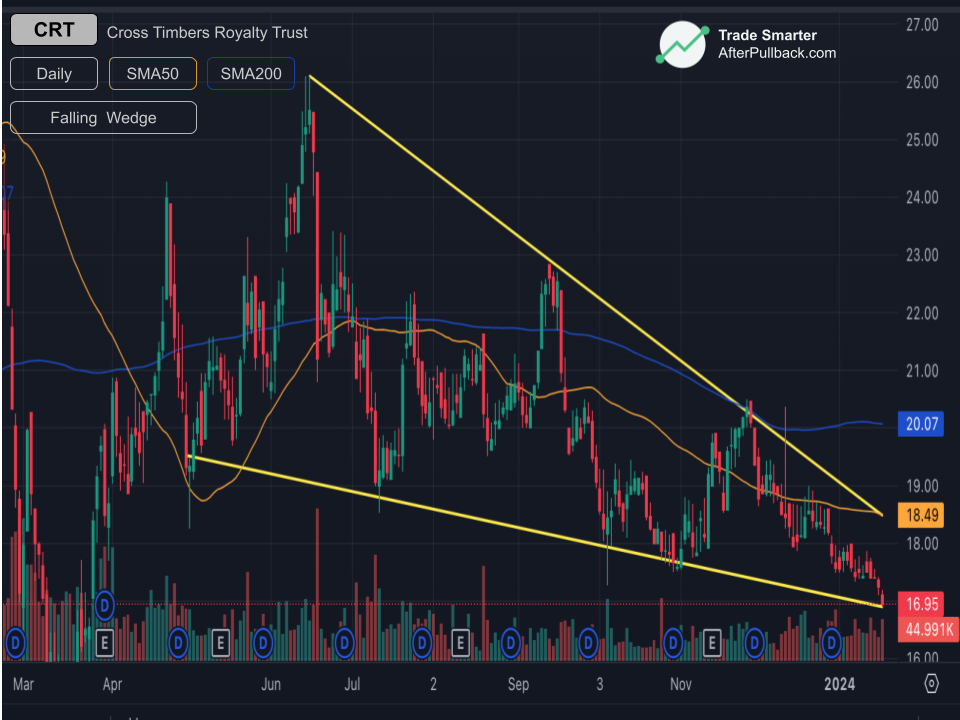
Falling Wedge
It's the counterpart to the rising wedge but with a more optimistic twist. It's a technical chart pattern that can signal a potential upward reversal in a downward trend. Imagine a downward-sloping...
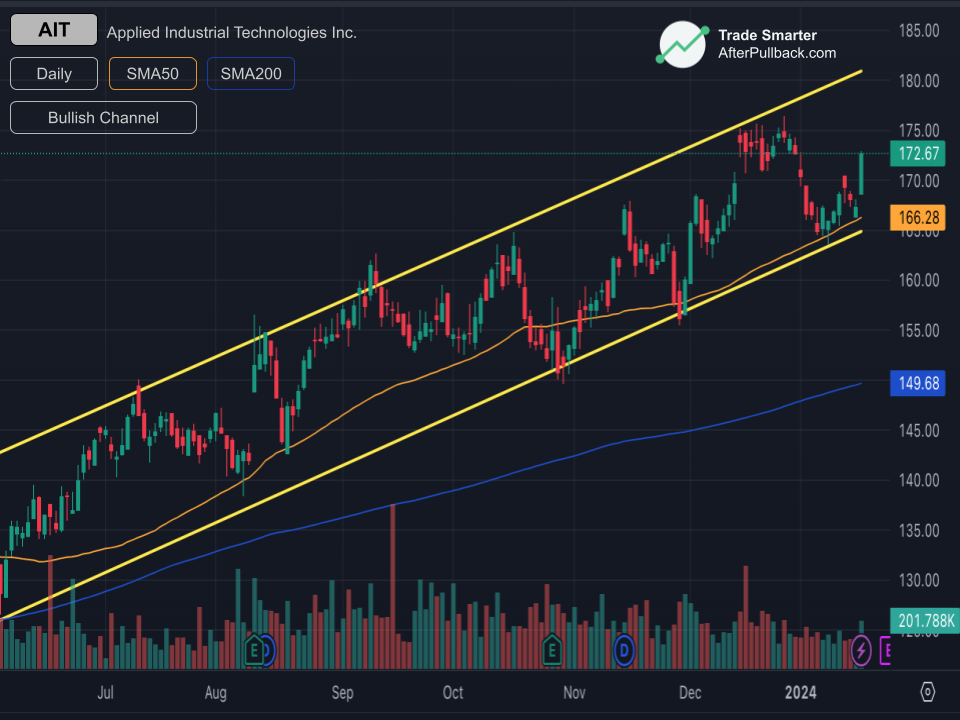
Bullish Channel
A bullish channel is a technical chart pattern characterized by two parallel upward-sloping trendlines. One trendline connects the swing lows (price dips), while the other connects the swing highs ...
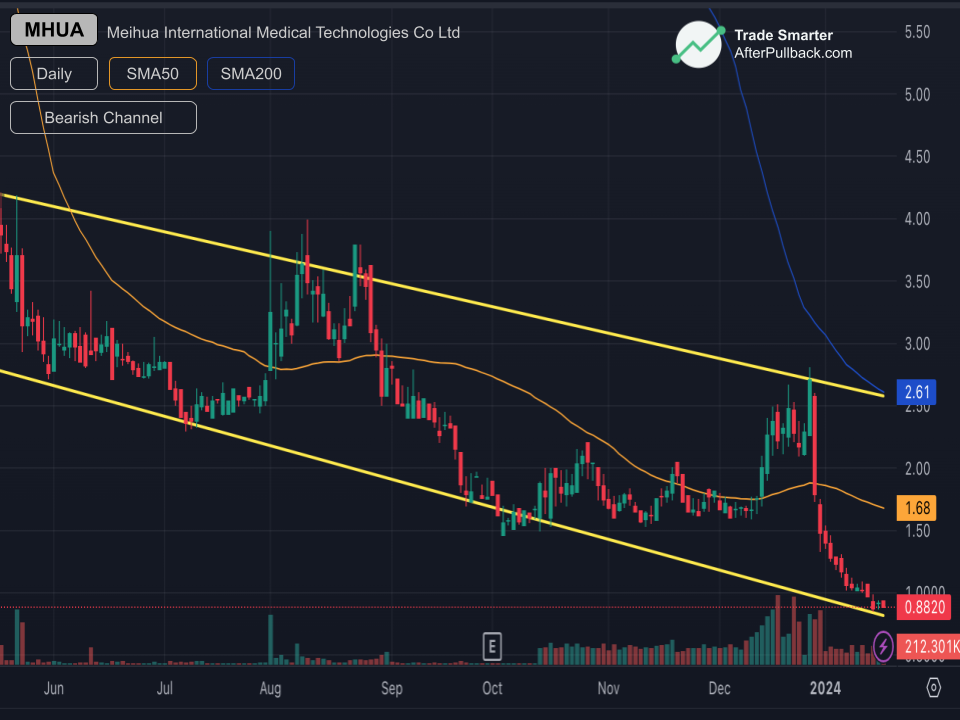
Bearish Channel
A bearish channel is a technical chart pattern formed by two parallel downward-sloping trendlines, one connecting the swing highs (price peaks) and the other connecting the swing lows (price dips)....
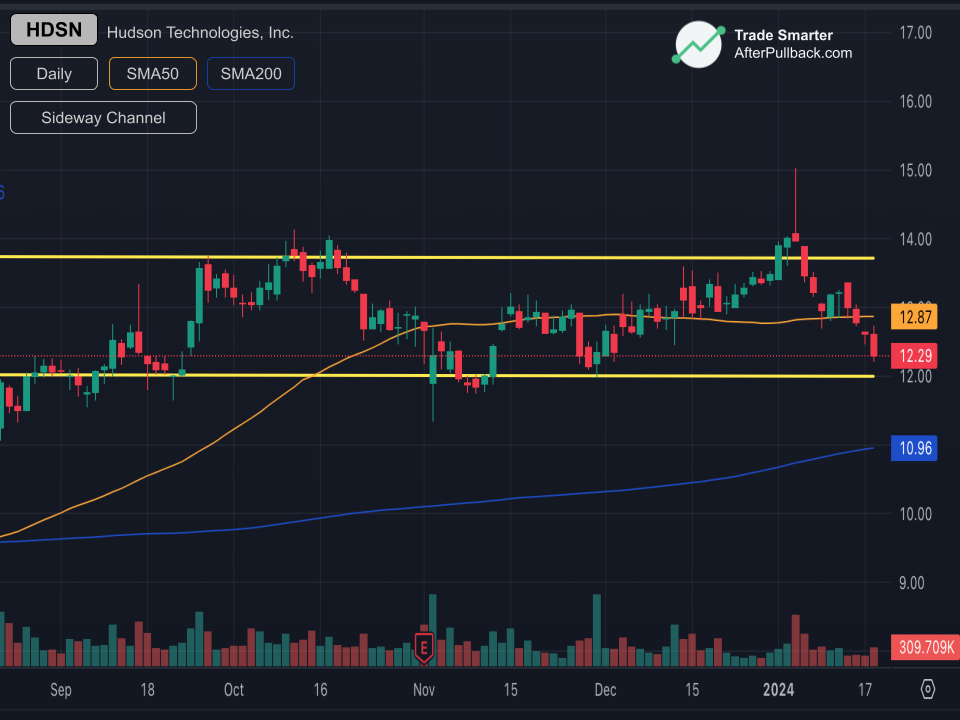
Sideway Channel
A sideways channel, also known as a horizontal channel or trading range, is a technical chart pattern formed by two almost horizontal trendlines, one connecting the swing highs (price peaks) and th...
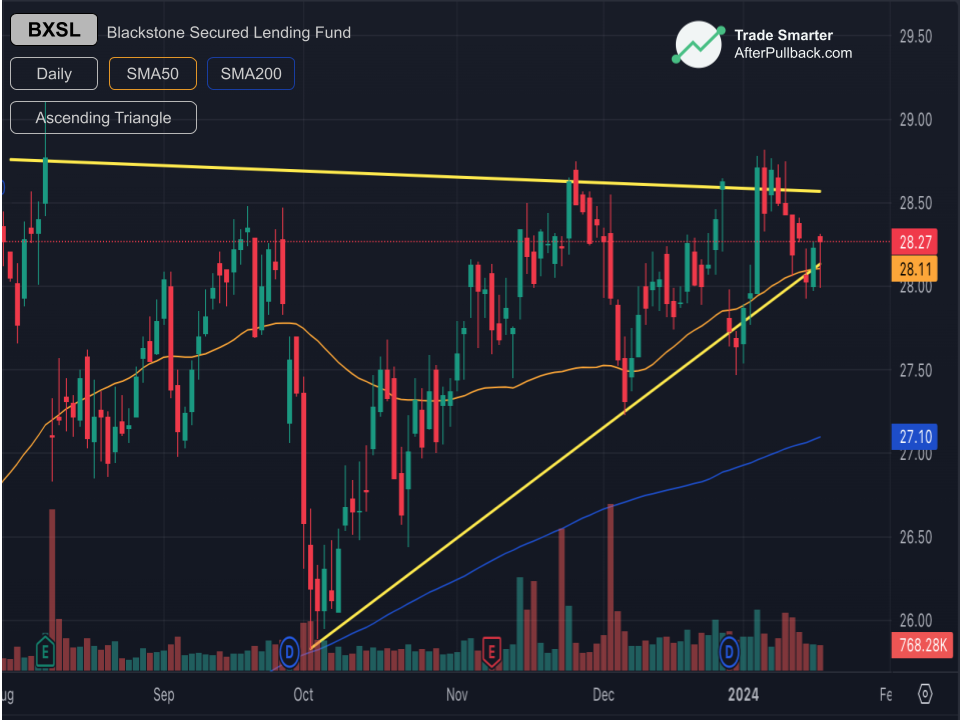
Ascending Triangle
Its a bullish continuation or reversal pattern formed within an uptrend or downtrend, respectively. It is defined by two converging trendlines, an Upper horizontal trendline connecting swing highs ...
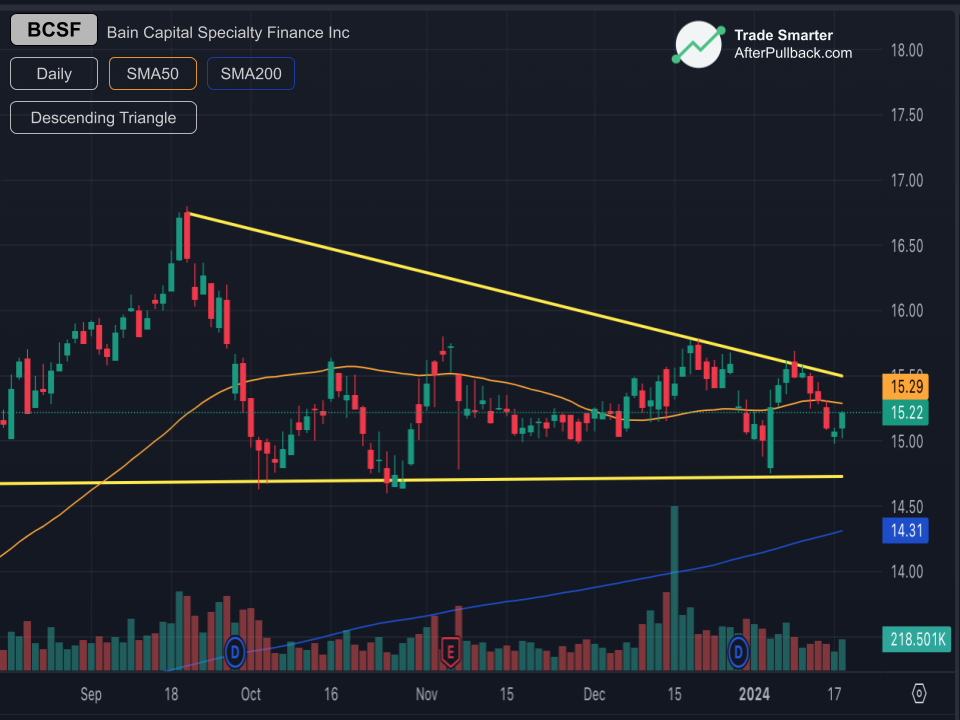
Descending Triangle
The Descending Triangle is a bearish continuation or reversal pattern formed within a downward trend. It consists of two converging trendlines, An upper downward-sloping trendline connecting swing ...
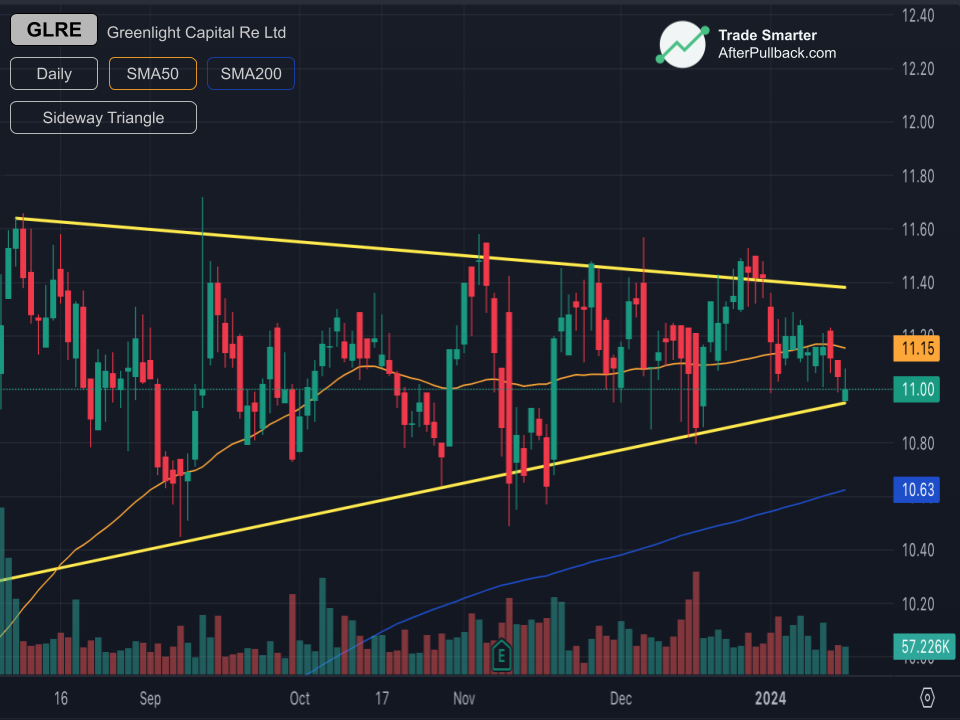
Sideway Triangle
The Sideways Triangle is a non-directional consolidation pattern formed within an already established uptrend or downtrend. It consists of two converging trendlines: An upper horizontal trendline c...
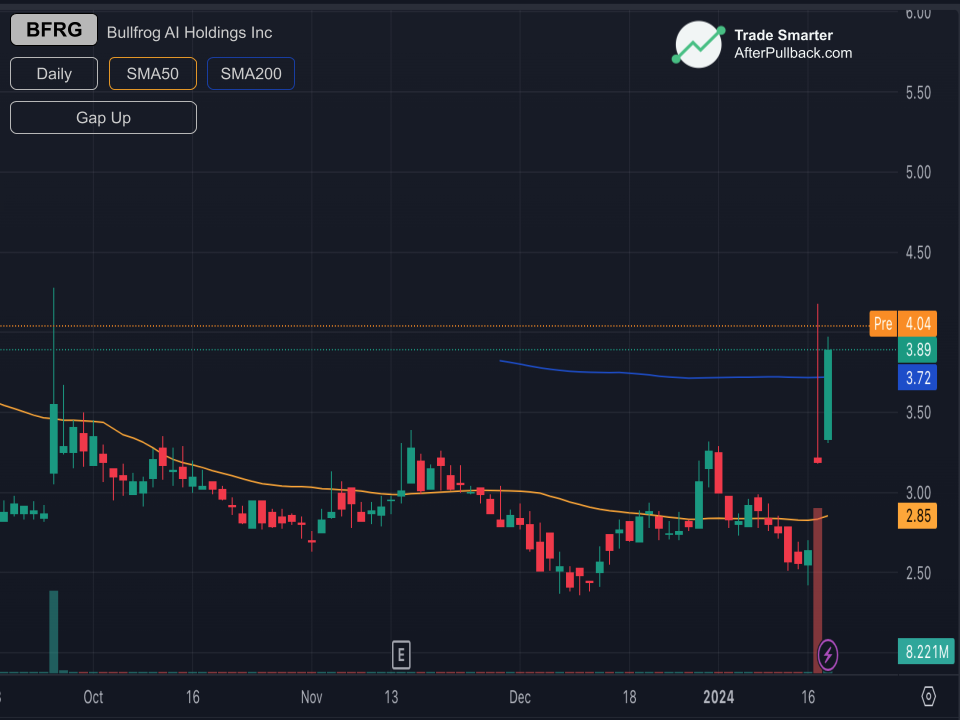
Gap Up
A Gap Up occurs when the current day's opening price is significantly higher than the previous day's closing price. This creates a visible gap on the price chart where no trading activity took plac...
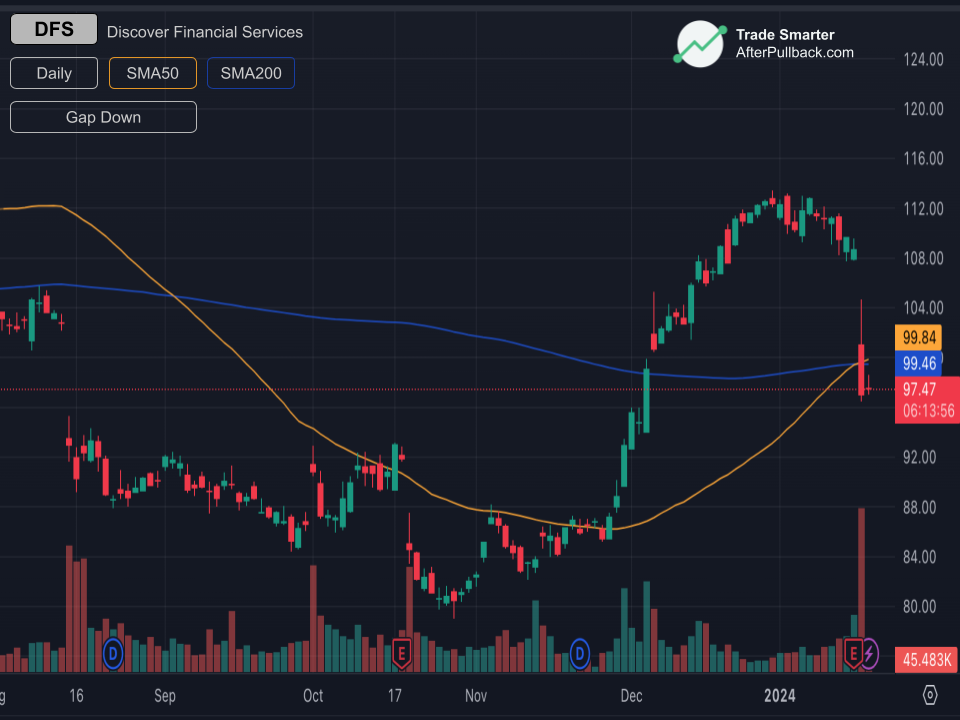
Gap Down
A Gap Down occurs when the current day's opening price is significantly lower than the previous day's closing price. This creates a visible gap on the price chart where no trading activity took pla...