Pattern Trading pattern description

RESISTANCE-pattern

Resistance Trend Line

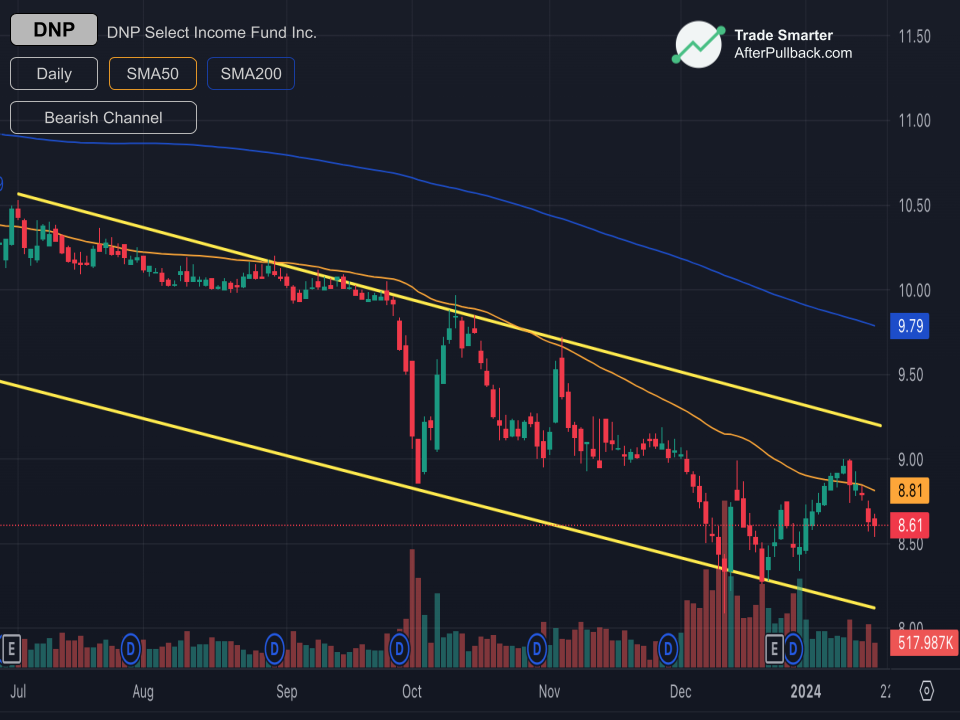
A Resistance Trend Line in trading is the opposite of a Support Trend Line. It's a line drawn on a chart connecting several high price points of an asset over time. It generally indicates a downward trend, where the price tends to get rejected after touching the line, acting like a ceiling for the price movement. It Provides potential entry points for short positions (selling) when the price approaches the line.

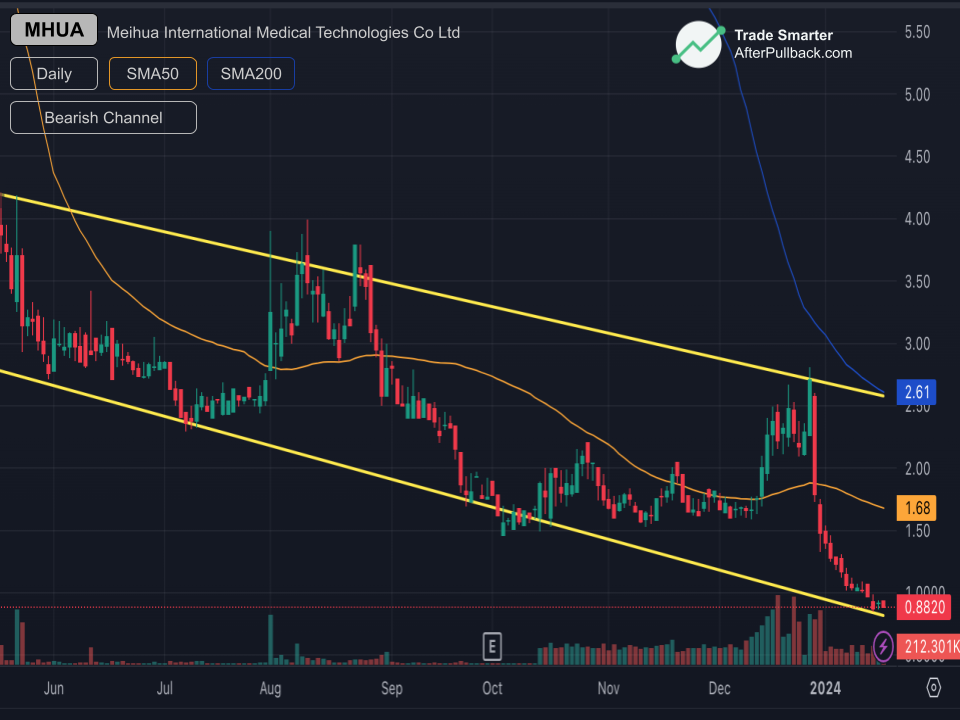
Resistance Trend Line, more examples


Market data may be delayed by 15 minutes or more and is provided by financial exchanges or third-party providers. AfterPullback does not verify or guarantee its accuracy and assumes no responsibility to do so. This website is not operated by a licensed attorney, accountant, or financial advisor. Nothing on this site constitutes financial advice or replaces consultation with a qualified professional who understands your specific circumstances. Always consult a licensed financial advisor before making investment decisions.