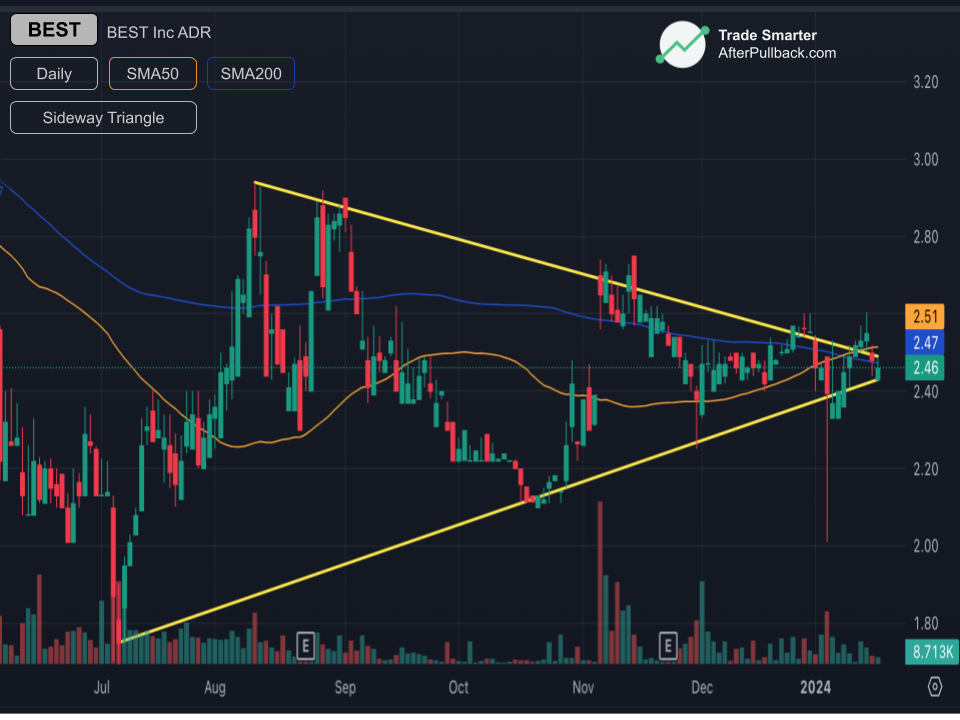
Sideway Triangle
The Sideways Triangle is a non-directional consolidation pattern formed within an already established uptrend or downtrend. It consists of two converging trendlines: An upper horizontal trendline connecting swing highs & a lower horizontal trendline connecting swing lows. The Sideways Triangle indicates a period of indecision or consolidation in the market, where neither buyers nor sellers have gained significant control. Eventually, the price will break out of the triangle either upwards or downwards, signaling a resumption of the previous trend or a potential trend reversal. The direction of the breakout depends on the prevailing trend before the triangle formation. In an uptrend, a break above the upper trendline signifies continuation, while a break below the lower trendline suggests a reversal. In a downtrend, the opposite interpretations apply.
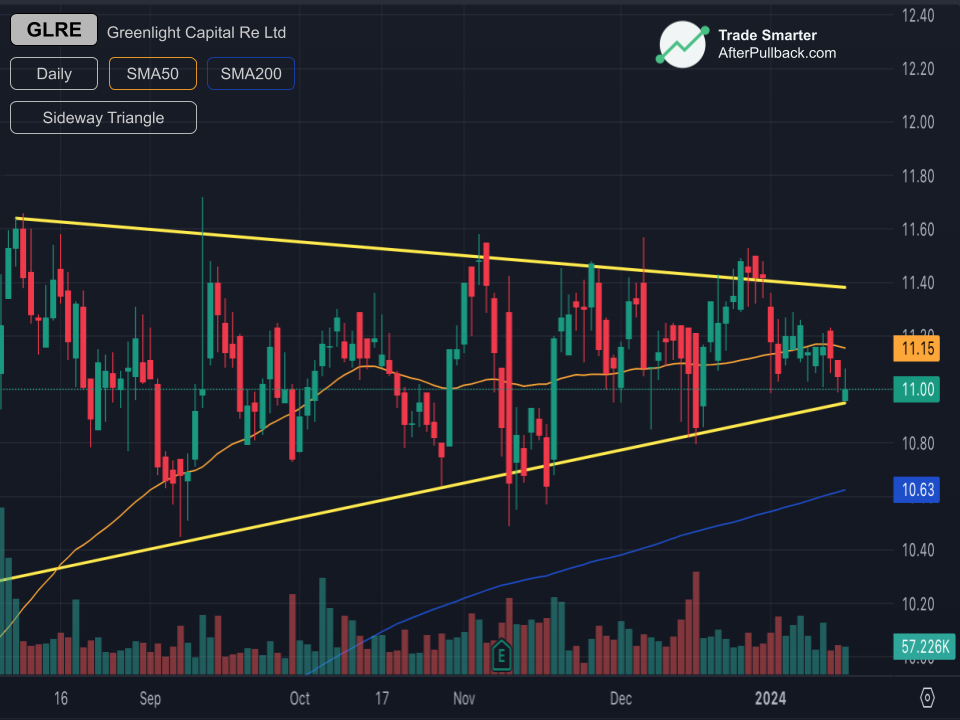
Sideway Triangle, more examples